Investors Relation

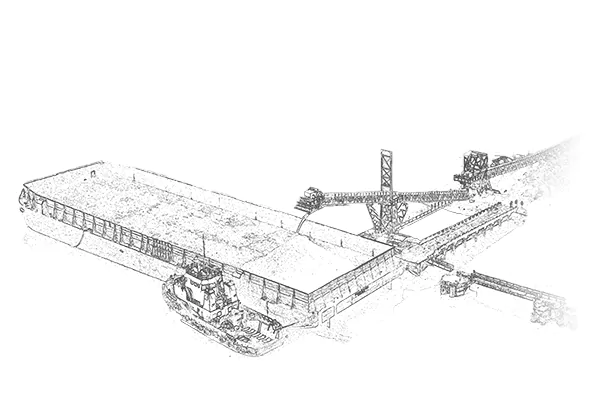
PT. Dana Brata Luhur is a Parent Company that carries out capital participation in infrastructure projects or companies. Through the Subsidiary, PT. Talenta Bumi, we focuses on running a business in the form of: Provision of mining infrastructure including haul roads, provision of stockpile areas, and operation of coal terminals.

Stock Information


Financial Highlights

Consolidated Statements as per 31 December 2025

Revenue

483.20

Billion IDR

Gross Profit

198.79

Billion IDR

Operating Profit

153.71

Billion IDR

Profit (Loss) for the Year

132.73

Billion IDR

Profit Attributable to Owners of Parent Entity

133.59

Billion IDR

Profit Attributable to Non-controlling Interests

0.86

Billion IDR

Return on Assets

10.37

percent

Return on Equity

10.90

percent

Net Profit Margin

27.65

percent

Current Ratio

12.71

percent

Debt to Equity Ratio

5.20

percent

Debt to Asset Ratio

4.95

percent

Consolidated Statements Summary of Profit and Other Comprehensive Income (in thousands IDR)

20252024202320222021202020192018
Revenue483.192.085566.674.463632.232.808781.793.751448.008.428197.952.877379.904.122295.394.538
Gross Profit198.789.485239.683.649329.620.411462.266.385241.123.16737.512.706115.505.064122.979.016
Operating Profit153.709.321157.835.763285.369.490418.015.565208.350.57810.661.65385.134.295103.898.315
Profit of the year133.585.879134.188.130221.711.596327.830.339165.614.881-2.525.00445.954.573204.653.278
Total Comprehensive Income134.138.088134.539.350221.940.649331.159.098165.001.7893.789.85845.472.889203.252.733
Profit Attributable to Owners of Parent Entity132.726.305133.192.340220.130.614325.445.065164.314.881-2.489.86545.556.260204.140.687
Profit Attributable to Non-controlling interests860.151995.7901.580.9822.385.2741.300.000-35.139398.313512.591
Total Profit Attributable133.585.879134.188.130221.711.596327.830.339165.614.881-2.525.00445.954.573204.140.687
Comprehensive Income Attributable to Owners of Parent Entity134.138.088133.539.836220.361.239328.771.374163.692.3093.805.12845.077.722202.738.574
Comprehensive Income Attributable to Non-controlling interests860.151999.5141.579.4102.387.7241.309.480-15.270395.167514.159
Total Comprehensive Income Attributable134.138.088134.539.350221.940.649331.159.098165.001.7893.789.85845.472.889203.252.733
Earning per Share103,29103,65171,31253,26127,87-2,320,04560,35
Basic103,29103,65171,31253,26127,87-2,320,04560,35
Diluted---0,03550,16

Consolidated Statements Summary of Financial Position (in thousands IDR)

20252024202320222021202020192018
Total Current Assets688.674.539490.969.528450.290.158454.419.703291.282.05282.923.190161.552.193132.483.874
Total Noncurrent Assets600.108.717670.365.093700.922.996848.085.684697.778.862751.115.725737.361.697765.778.531
Total Assets1.288.783.2561.161.334.6211.150.900.6541.302.505.387989.060.914834.038.915898.913.890898.262.405
Total Current Liabilities54.189.70751.269.87447.641.053235.004.803116.195.37878.671.662120.301.292194.724.784
Total Noncurrent Liabilities9.554.55718.367.22116.170.04013.188.46759.001.14299.988.283119.034.164122.159.663
Total Liabilities63.744.26469.637.09563.811.093248.193.270175.196.520178.659.945239.335.456316.884.447
Equity Attributable to Owners of Parent Entity1.217.545.2401.084.267.5261.079.227.4671.046.476.228807.654.854650.261.006654.394.200576.588.891
Equity Attributable to Non-controlling Interests7.493.7527.430.2237.862.0947.835.8896.209.5405.117.9645.184.2344.789.067
Total Equity1.225.038.9921.091.697.5261.087.089.5611.054.312.117813.864.394655.378.970659.578.434581.377.958
Total Liabilities and Equity1.288.783.2561.161.334.6211.150.900.6541.302.505.387989.060.914834.038.915898.913.890898.262.405

Annual Report

2025

Accelerating Expansion, Sustaining Growth

Sustainability Report

2024

Sustainability Performance (page 190)

EN